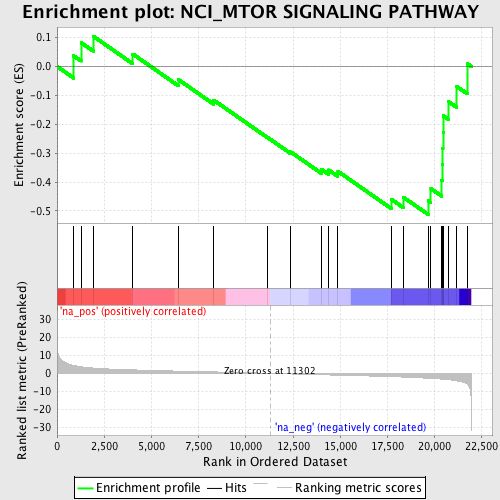
Profile of the Running ES Score & Positions of GeneSet Members on the Rank Ordered List
| Dataset | set01_ATM_minus_versus_SCID |
| Phenotype | NoPhenotypeAvailable |
| Upregulated in class | na_neg |
| GeneSet | NCI_MTOR SIGNALING PATHWAY |
| Enrichment Score (ES) | -0.5121877 |
| Normalized Enrichment Score (NES) | -1.6479496 |
| Nominal p-value | 0.017977528 |
| FDR q-value | 0.3729947 |
| FWER p-Value | 0.995 |
| PROBE | GENE SYMBOL | GENE_TITLE | RANK IN GENE LIST | RANK METRIC SCORE | RUNNING ES | CORE ENRICHMENT | |
|---|---|---|---|---|---|---|---|
| 1 | PIK3R1 | 880 | 4.360 | 0.0366 | No | ||
| 2 | EIF4G1 | 1269 | 3.611 | 0.0826 | No | ||
| 3 | RHEB | 1909 | 2.934 | 0.1051 | No | ||
| 4 | AKT1 | 4013 | 1.922 | 0.0430 | No | ||
| 5 | MKNK1 | 6427 | 1.234 | -0.0453 | No | ||
| 6 | INSR | 8289 | 0.805 | -0.1160 | No | ||
| 7 | PPP2R5D | 11123 | 0.055 | -0.2442 | No | ||
| 8 | EIF4EBP1 | 12380 | -0.326 | -0.2958 | No | ||
| 9 | RPS6 | 13992 | -0.776 | -0.3556 | No | ||
| 10 | FKBP1A | 14387 | -0.874 | -0.3582 | No | ||
| 11 | EIF4A1 | 14880 | -1.009 | -0.3628 | No | ||
| 12 | IRS1 | 17725 | -1.828 | -0.4603 | No | ||
| 13 | PDPK1 | 18359 | -2.062 | -0.4529 | No | ||
| 14 | PRKAB1 | 19660 | -2.688 | -0.4648 | Yes | ||
| 15 | FRAP1 | 19809 | -2.769 | -0.4228 | Yes | ||
| 16 | TSC2 | 20379 | -3.156 | -0.3932 | Yes | ||
| 17 | RPS6KB1 | 20405 | -3.174 | -0.3384 | Yes | ||
| 18 | PIK3CA | 20435 | -3.207 | -0.2832 | Yes | ||
| 19 | PTEN | 20449 | -3.224 | -0.2271 | Yes | ||
| 20 | EIF4E | 20471 | -3.243 | -0.1709 | Yes | ||
| 21 | PPP5C | 20735 | -3.488 | -0.1215 | Yes | ||
| 22 | EEF2 | 21183 | -4.108 | -0.0695 | Yes | ||
| 23 | TSC1 | 21728 | -5.921 | 0.0100 | Yes |
